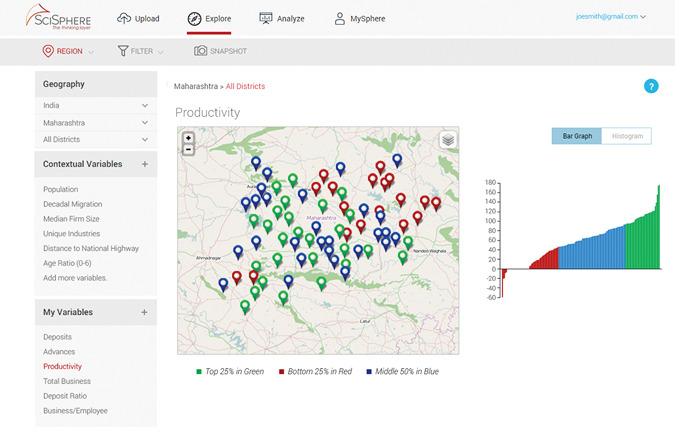
Learn how your branch performance distributes across geographies and why this often reflects economic context rather than internal operation.

Understand how our nonlinear machine learning location selection model works.
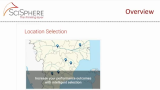
See how you can quickly use the results of our location selection models on SciSphere to shortlist places.
See the potential impact of our location selection analytics in a live case study of a private sector bank.

Understand the various derived variables on SciSphere and how they are powerful predictors of the success and growth of microeconomies.

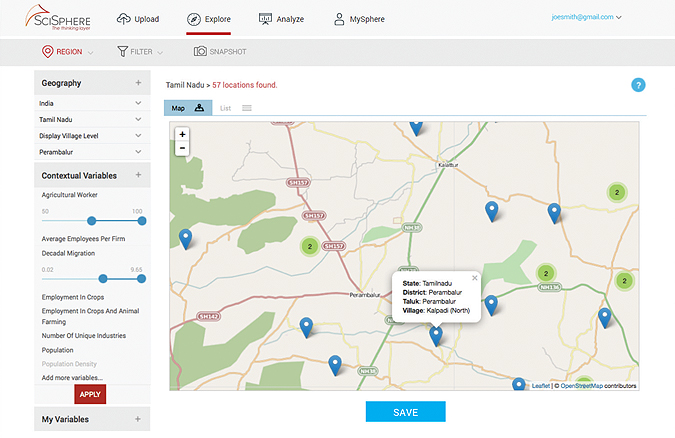
This video outlines the features of the Explore features on SciSphere and a potential use case.
Understand what goes behind our Analytics feature, start to finish.
SciSphere’s powerful derivative variables from the economic census and census provide strong predictors of economic growth down to the village level. Using these variables such as average firm size, economic diversity and decadal migration that research has shown to be strong correlates of economic growth and robustness, Banks can quickly identify the more vibrant areas at all scales from cities to towns to villages. In addition, maps showing the densities of different industries can also help better target products to different geographies. For example, easily find all the places with high concentration of a particular industry of interest.
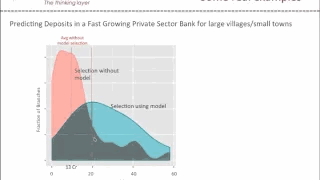
SciSphere's location selection algorithm also goes one step further to provide cutting edge analytics to predict which places will offer the highest potential for your particular products and business metrics. Our case studies have shown very high accuracy of our models in predicting the potential for deposits and advances. Watch our demo videos to learn more.
Start your Free Trial nowFree Sign Up

Learn how Madura Microfinance has been using SciSphere.
See how you can quickly use the results of our location selection models on SciSphere to shortlist places.
Understand the various derived variables on SciSphere and how they are powerful predictors of the success and growth of microeconomies.
Learn how your branch performance distributes across geographies and why this often reflects economic context rather than internal operation.
Understand how our nonlinear machine learning location selection model works.

See the potential impact of our location selection analytics in a live case study of a rural microfinance institution.
This video outlines the features of the Explore features on SciSphere and a potential use case.
Understand what goes behind our Analytics feature, start to finish.
SciSphere’s powerful derivative variables from the economic census and census describe average firm size, economic diversity, decadal migration and other descriptors of microeconomies right down to the village level. This allows easy selection and classification of villages by potential and risk and also the scope for more tailored product innovation. Using SciSphere Explore can substantially reduce time to market and enable shortlisting of more high potential locations within minutes.
SciSphere's location selection algorithm also goes one step further to provide cutting edge analytics to predict which places will offer the highest potential for various business metrics such as Portfolio growth and Portfolio at Risk. Our case studies have shown very high accuracy of our models in predicting the risk profile of places in terms of the likelihood of delayed payments and defaults. Watch our demo videos to learn more.
Start your Free Trial nowFree Sign Up
Coming Soon
Coming Soon
Currently available datasets are derived from the Census (2001, 2011) and Economic Census (2005) and are referenced at the settlement level
Coming SoonDatasets from RBI, Credit Bureaus Ward/Neighborhood level granularity within cities
Understand your markets and make faster, more efficient location decisions
Easy visualization of 300+ economic, demographic and geospatial characteristics down to the village level from census 2011, economic census, RBI and other sources.
Visualize your branch data to gain expanded insights into drivers of performance
Analyze provides various applications for predictive analytics and planning at the click of a button.
Our applications currently focus on location selection and location based planning.
These features are currently in beta and are accessible only to select customers.
See how you can take advantage of them right now!
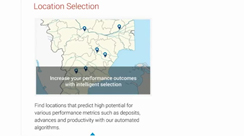
Find locations that predict high potential for various performance metrics such as deposits, advances and productivity with our automated algorithms.

We often set targets and incentives uniformly across geographies even though location potential varies widely. Plan in more targeted ways using location intelligence.
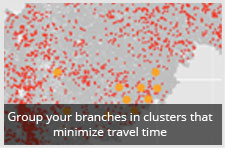
Regions are often based on government boundaries. Organize your branches based on distance to gain significant benefits in operational efficiency.
This video outlines the features of the Explore features on SciSphere and a potential use case.
Understand the various derived variables on SciSphere and how they are powerful predictors of the success and growth of microeconomies.
Learn how your branch performance distributes across geographies and why this often reflects economic context rather than internal operation.
Understand how our nonlinear machine learning location selection model works.
See how you can quickly use the results of our location selection models on SciSphere to shortlist places.
See the potential impact of our location selection analytics in a live case study of a private sector bank.
See the potential impact of our location selection analytics in a live case study of a rural microfinance institution.
Learn how Madura Microfinance has been using SciSphere.
Understand what goes behind our Analytics feature, start to finish.
04.11
07.53
08.50
08.02
06.35
05.47
01.40
01.57
11.59